Decoding Persian News: Unleashing the Power of Analytics

Welcome to an exciting journey where we explore Persian News through the lens of analytics. Join me as we dive into the world of news analysis and uncover meaningful insights using charts and numbers. In this exploration, we aim to shed light on Persian News stories by harnessing the power of data visualization and quantitative analysis. By combining the art of storytelling with the precision of data, we’ll strive to unravel the narratives hidden within the news and present them in a captivating and informative manner. So, fasten your seat belts as we embark on this data-driven adventure, where we bridge the gap between news and analytics.
📃 Data Gathering From Web
Let’s begin by gathering data from the web. To accomplish this, we’ll utilize a script that we’ve developed. This script will assist us in collecting data from various news agencies. Throughout this process, we’ll be gathering a substantial number of news articles from several websites. To organize and store all this valuable data, we have opted to utilize SQLite, a reliable database management system. By leveraging the power of SQLite, we can effectively store and manage the collected data for further analysis. It’s worth mentioning that we have successfully stored a significant dataset of approximately 178,480 articles. The fascinating part is that you can access this extensive dataset on the Kaggle website. Feel free to dive into the dataset and uncover intriguing insights and trends within the realm of news.
Persian News Dataset
Ideal for NLP tasks, sentiment analysis, topic modeling, and more.
www.kaggle.com
📂 Exploring News By Service
To begin, we process our data and determine the number of articles in each category, i.e. Service. After developing a Python script and processing the entire dataset, we observe that the International category consistently has a higher article count compared to other categories. Interestingly, the Arts and Media category ranks at the bottom of the list. To visualize this, we present a pie chart below showcasing the percentage distribution of all the categories.

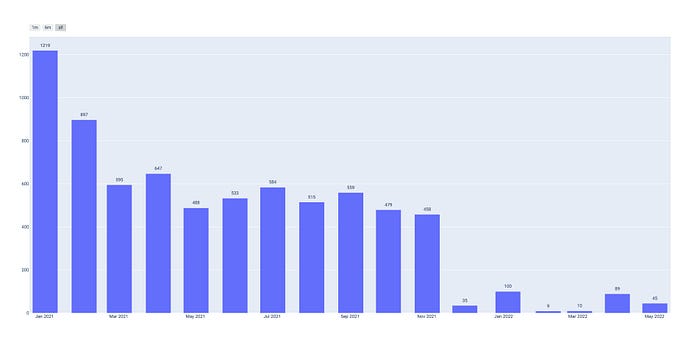
🗓️ Exploring News By Published Date
We believe it’s essential to explore this dataset by taking into account the publication dates of the articles. Our initial focus is on understanding the number of articles published each month, which allows us to uncover intriguing trends. Are the article numbers steadily increasing or decreasing over time? By delving into this analysis, we gain valuable insights into the dataset’s dynamics and discover interesting patterns that shape the article landscape. This temporal exploration adds an extra layer of understanding and reveals how article frequency evolves throughout the period of study. The picture below will illustrate this trend:

🏷️ Exploring News By Single tag
This dataset has all the article tags in it. We thought it’d be really interesting to take a look at some of the most important tags among these articles. In this section, you’ll get to see the frequencies of these tags for each month, starting from the beginning date all the way to the end date. If you’re curious about how many articles contain a specific word, you can totally check out our Repository and customize the code to your liking. And hey, take a look at the plot below to see the number of articles that have the tag “The U.S.” It’s pretty neat, right? Happy writing!
💻 End note
This article is all about taking a fun beginner-level journey into the world of playing with data and discovering interesting information. If you’re someone who loves to dive into data and explore, this is the perfect read for you! And guess what? If you want to get your hands on this dataset and have some fun with it, just head over to the Kaggle Repository that I mentioned earlier. Oh, and here’s an exciting opportunity for you — you can actually contribute to the data gathering scripts in the repository below. Let’s embark on this data adventure together! 🚀